By Bill Adams, President
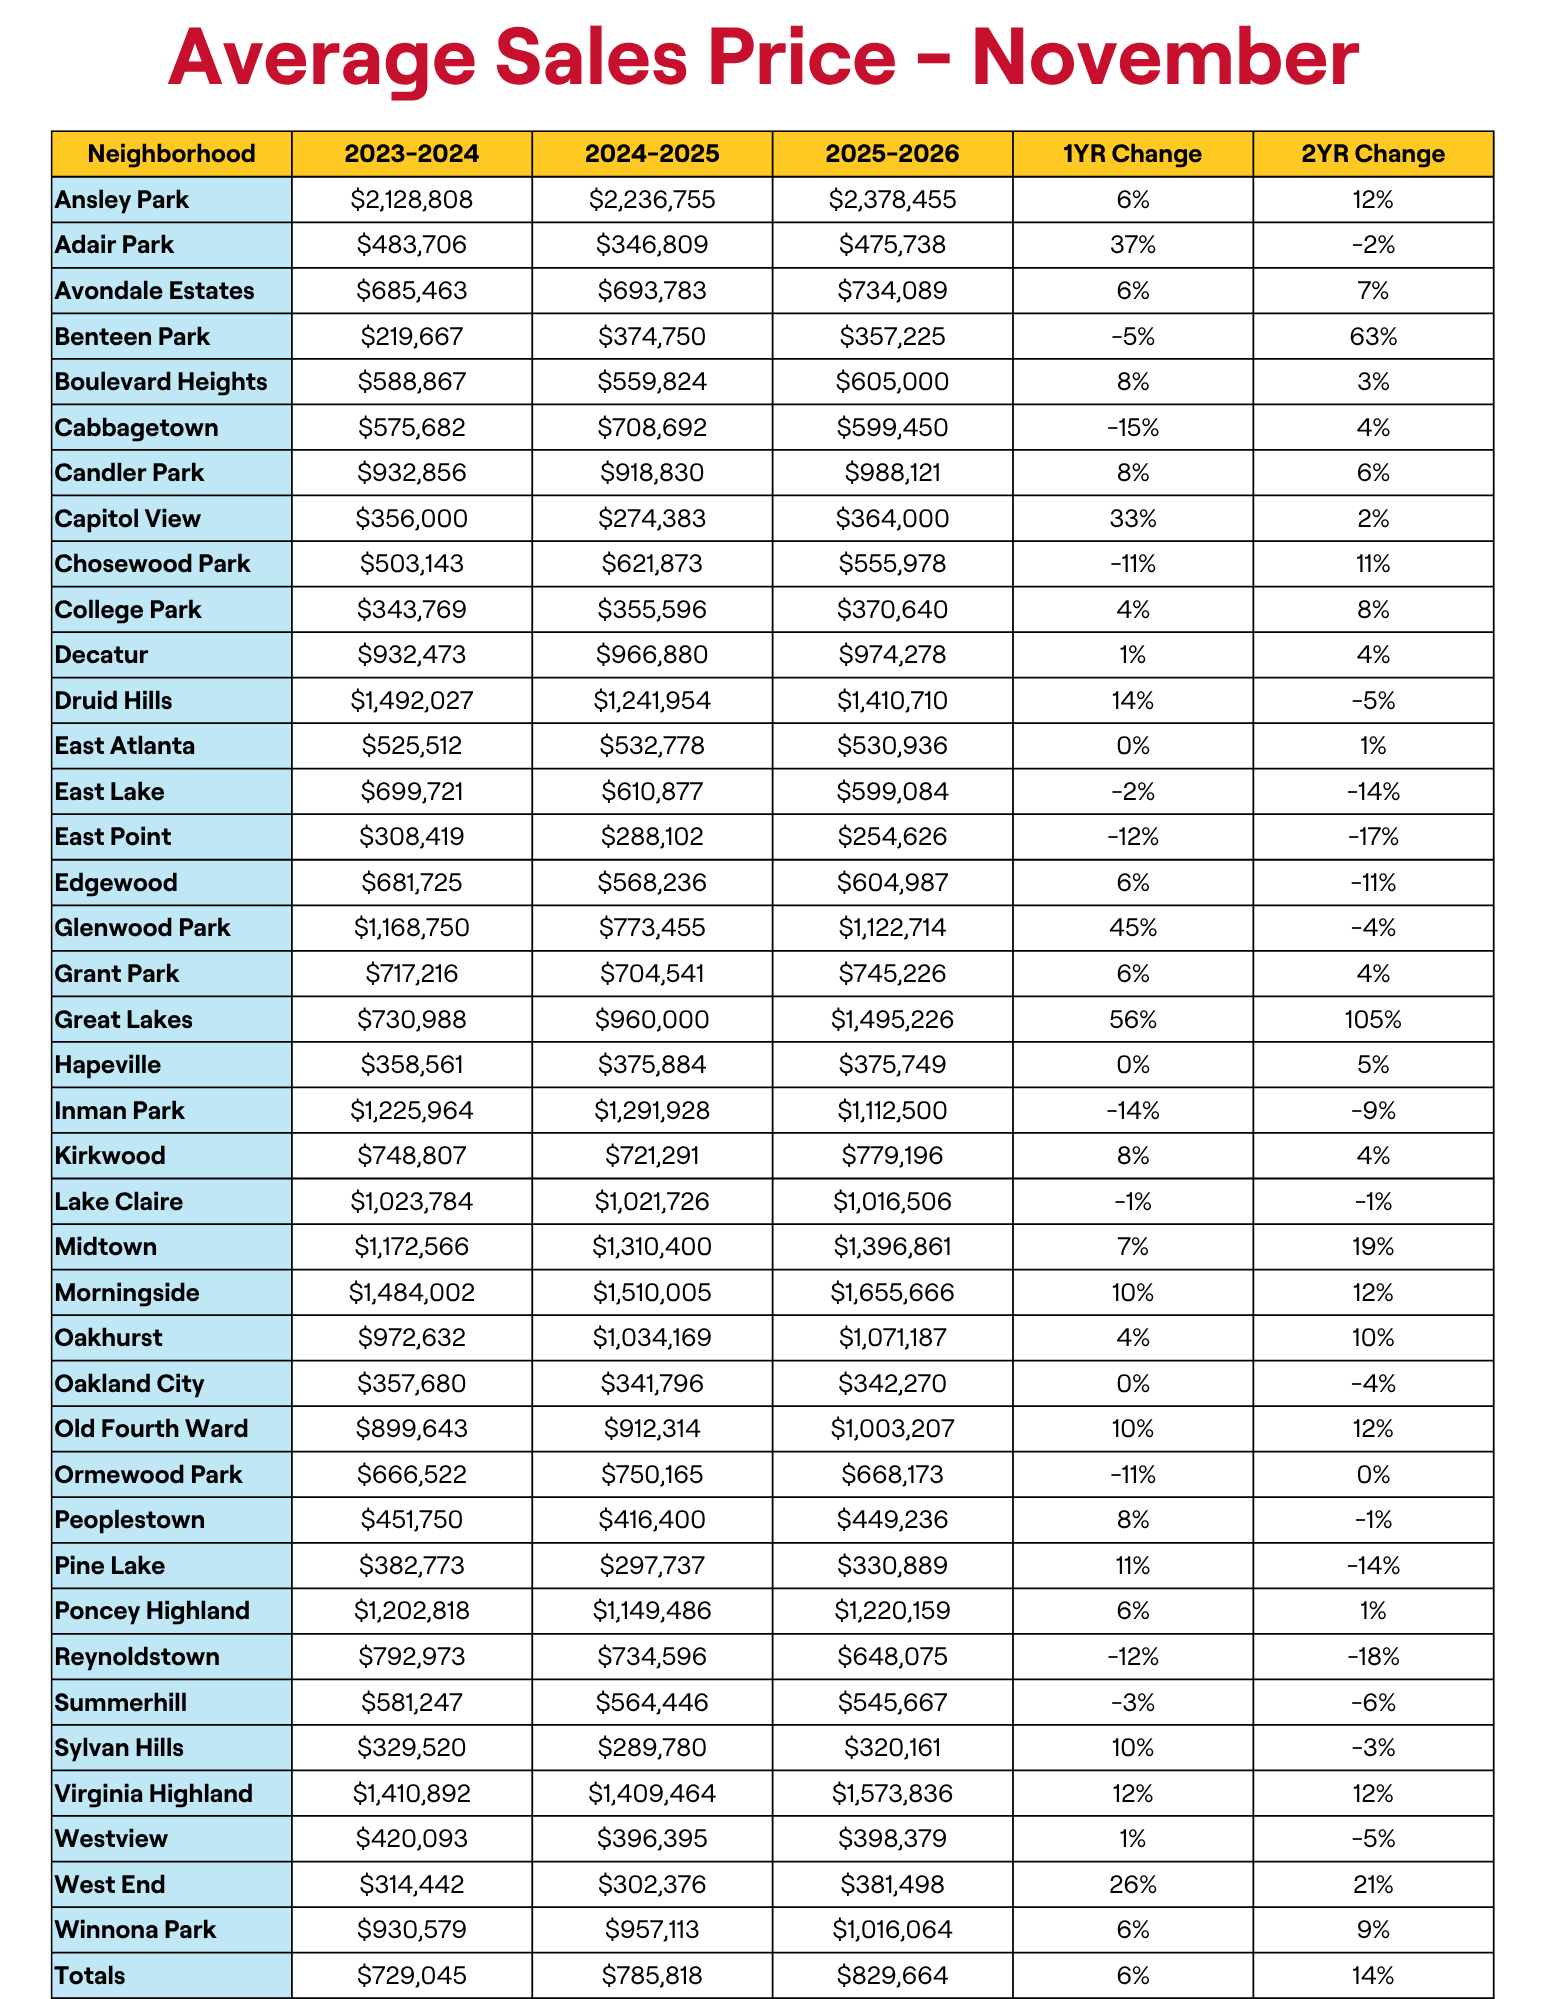
Prices rose in 24 of 36 Intown neighborhoods over the past year, though market growth is being driven by higher prices rather than an increase in transactions. All figures below reflect trailing 12-month data through November 1, 2026, for single-family detached homes from the Adams Realtors Intown Market Survey.
Where We Stand
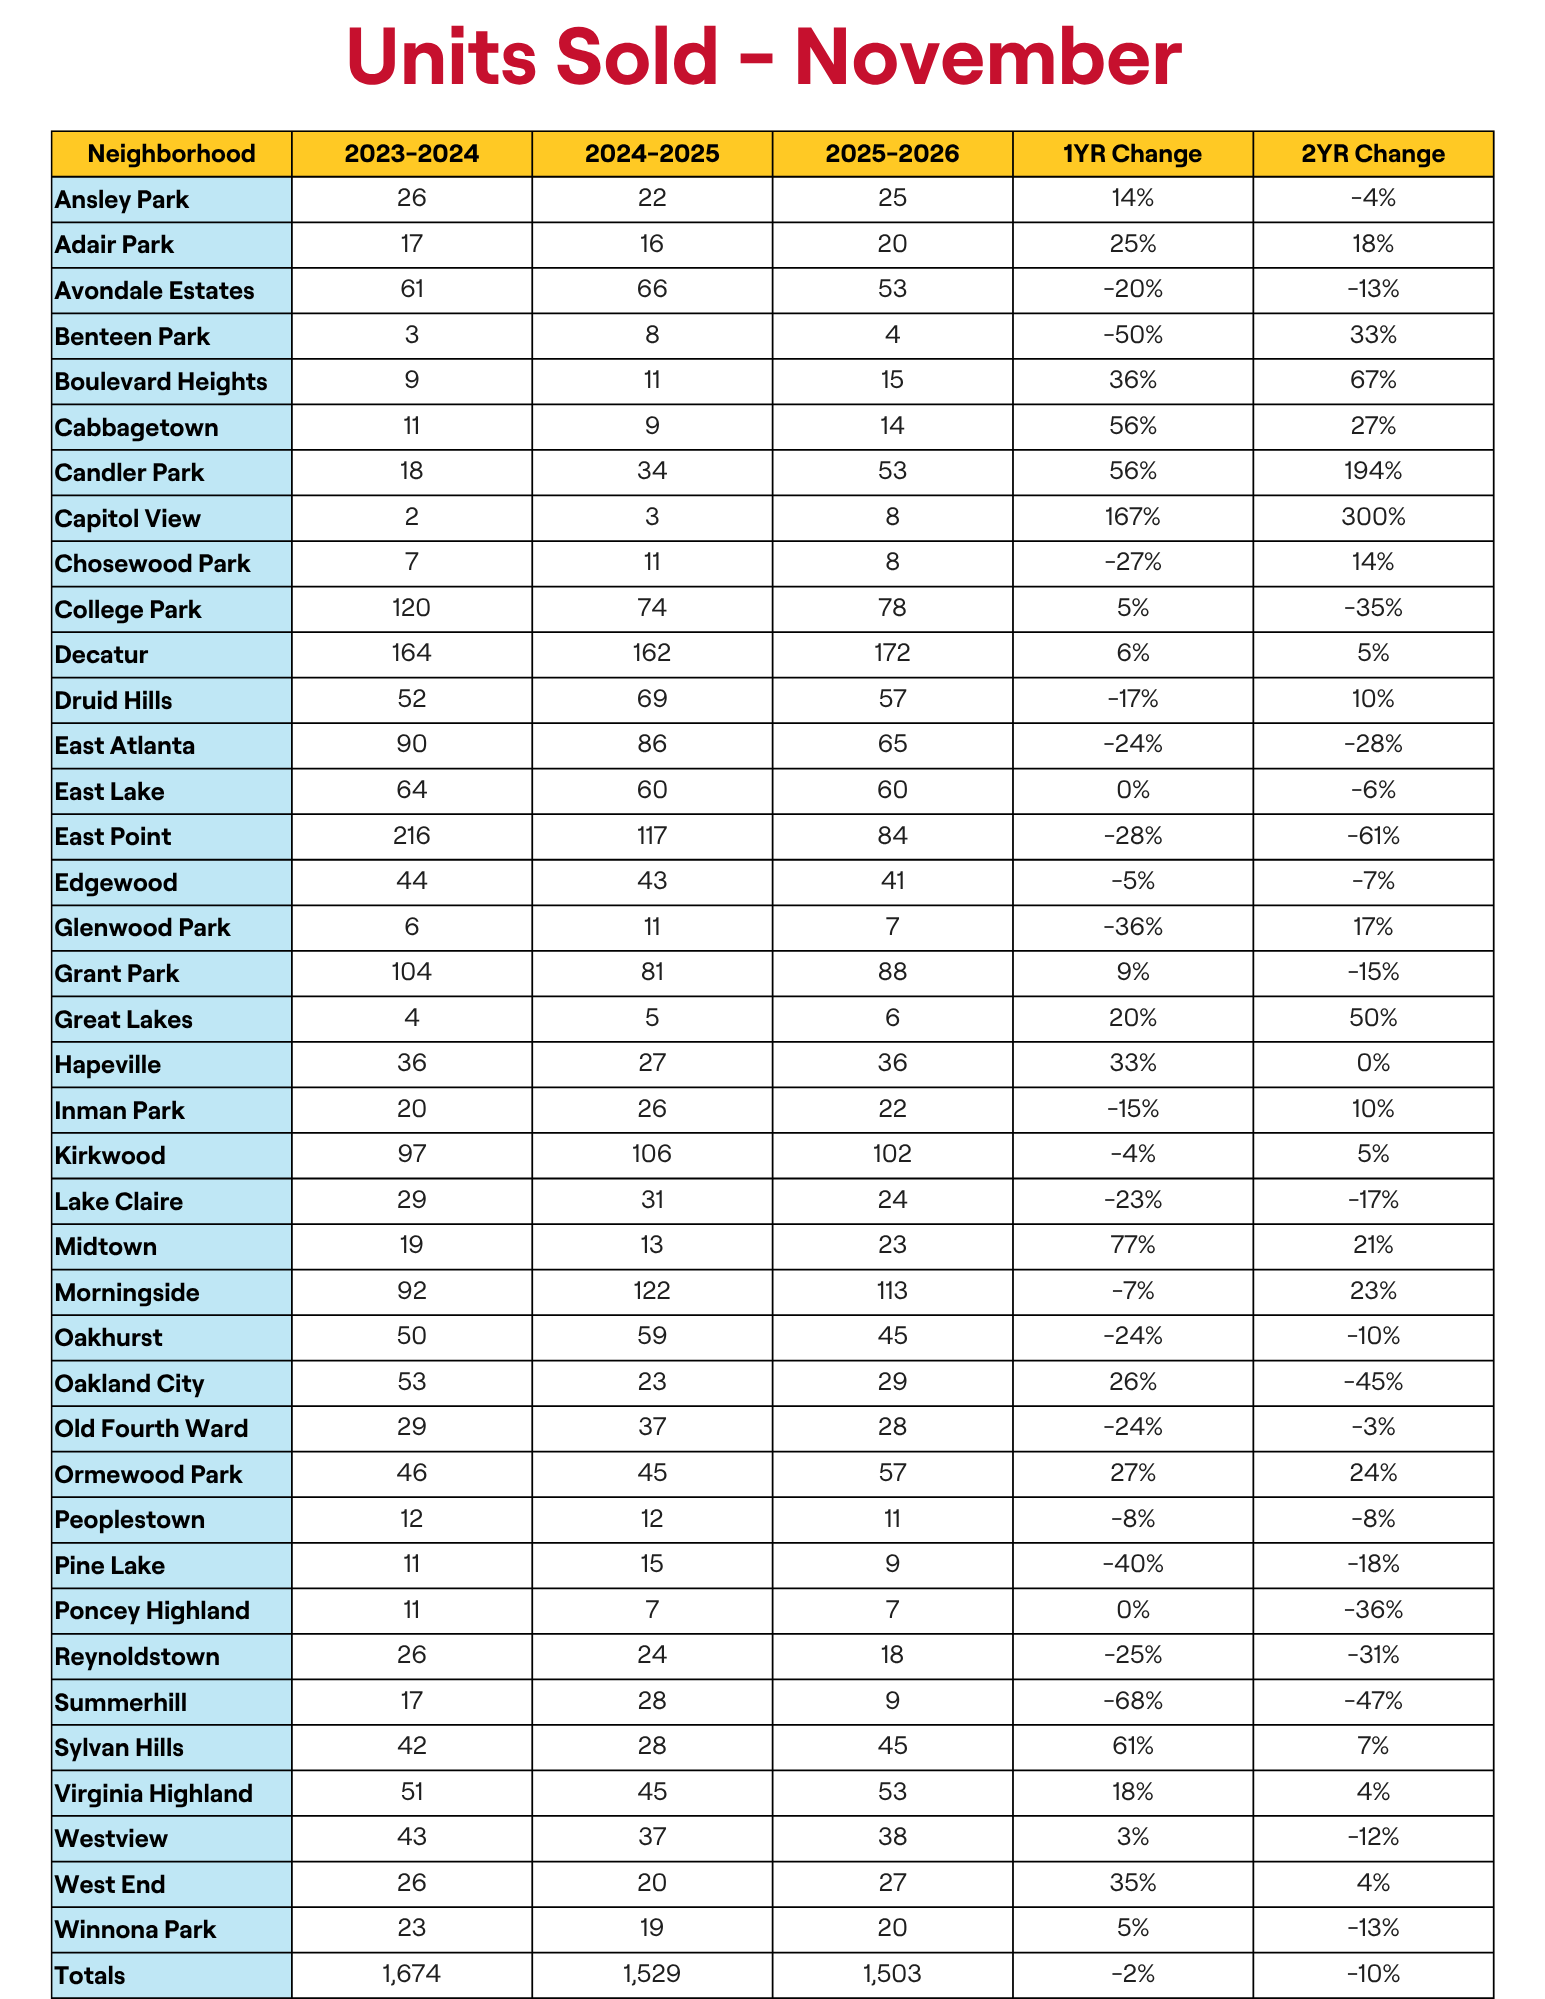
Over the past two years, average sale prices across Intown Atlanta are up 13.8%, while overall unit sales are down 10.2%. (Note: Totals cover 36 of the 39 neighborhoods in our survey; see the methodology note at the bottom regarding the City of Decatur.)
| Measure | 2023–24 | 2024–25 | 2025–26 | 1-Yr Change |
|---|---|---|---|---|
| Average Sale Price | $729,000 | $785,800 | $829,700 | +5.6% |
| Homes Sold | 1,574 | 1,529 | 1,503 | −1.7% |
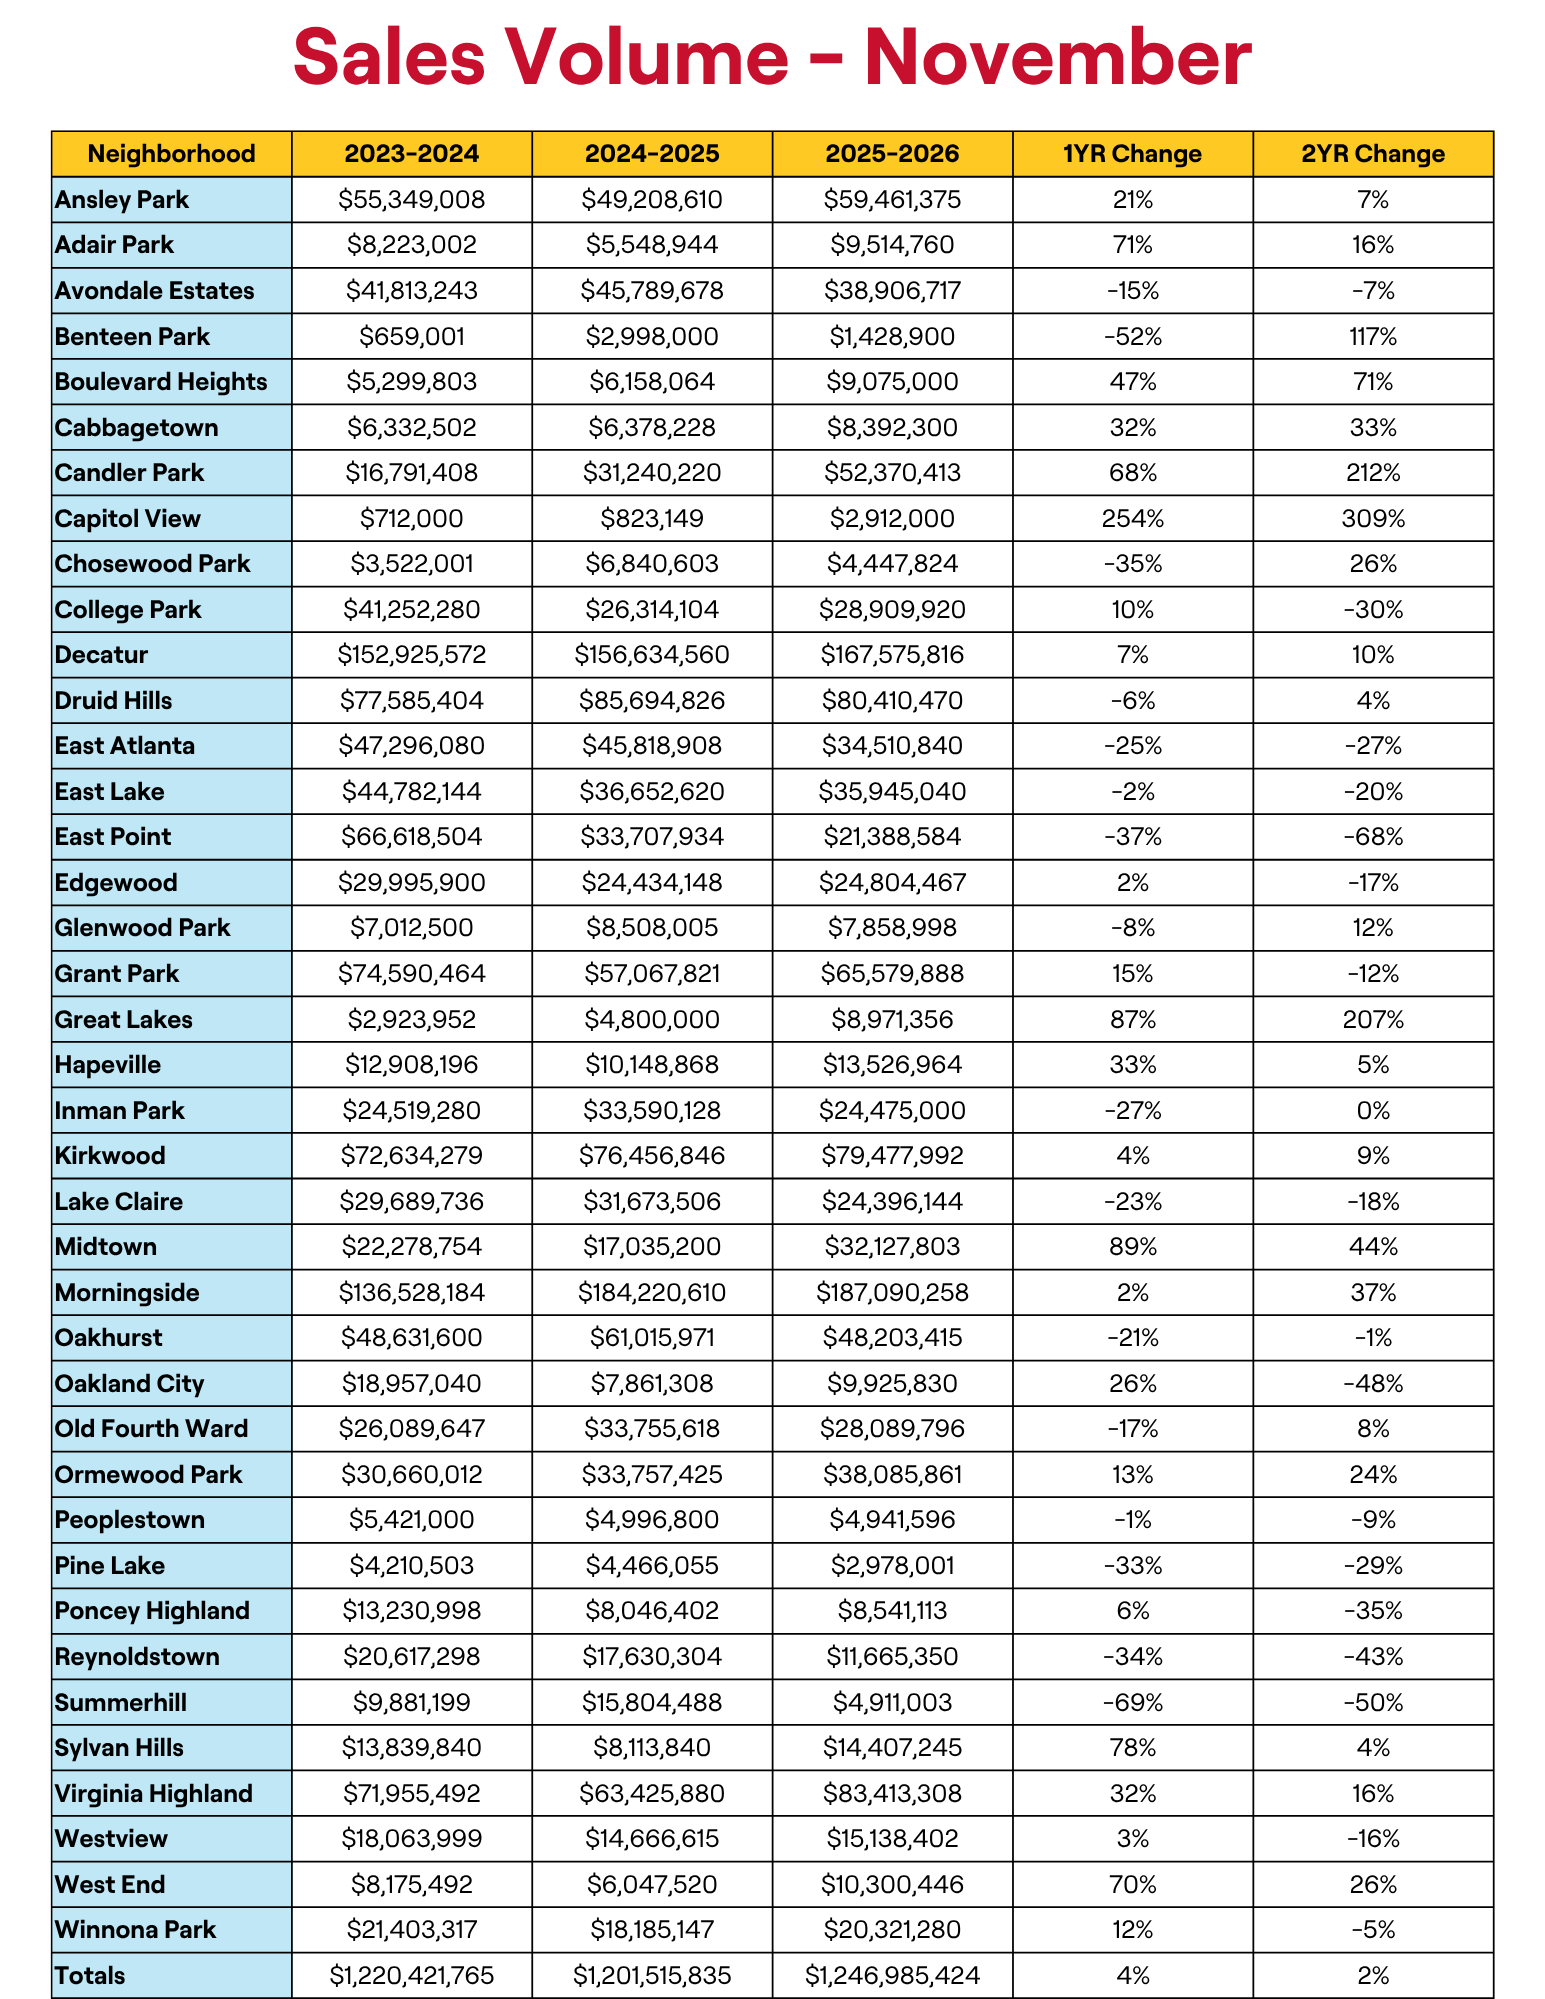
| Sales Volume | $1.22B | $1.20B | $1.25B | +3.8% |
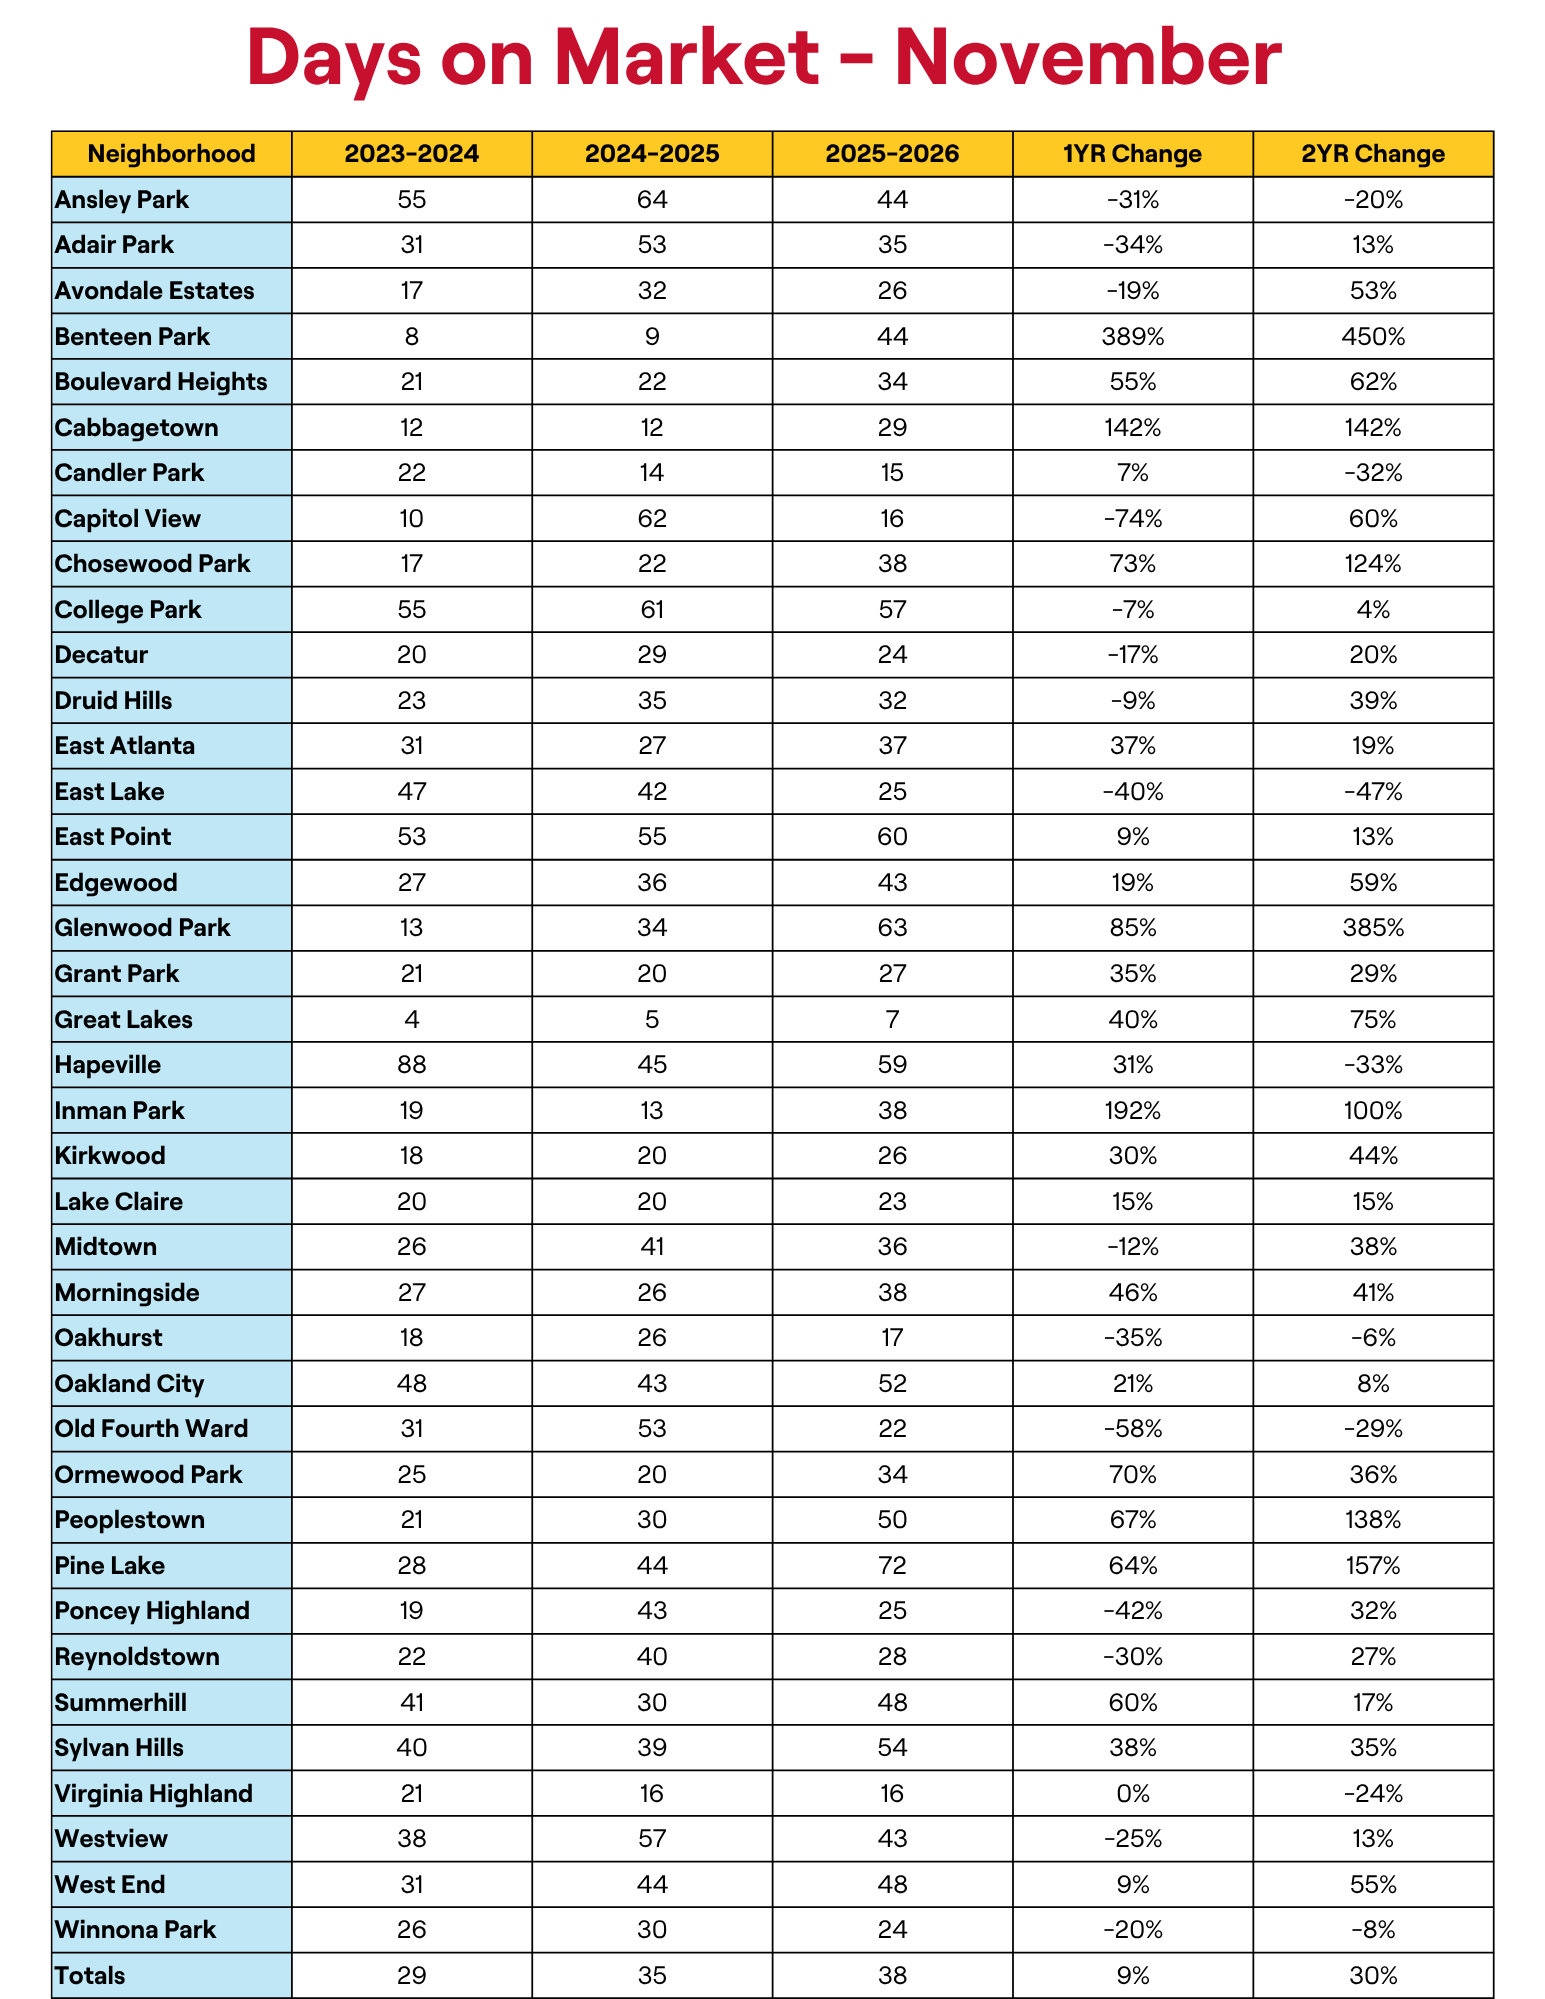
| Avg. Days on Market | 29 | 35 | 38 | +9% |
Three Tiers, Three Stories
A closer look by price bracket reveals a bifurcated market: the $1M+ luxury tier remains our strongest segment, while higher mortgage rates are putting the most pressure on buyers in the under-$500K tier.
| Tier (Neighborhoods) | Avg. Price (1-Yr Change) | Homes Sold (2 Yrs Ago → Now) | Avg. Days on Market |
|---|---|---|---|
| Over $1M (10) | $1.49M +11% | 335 → 359 | 34 |
| $500K–$1M (14) | $763K +4.2% | 758 → 755 | 31 (was 24) |
| Under $500K (12) | $348K −5.2% | 581 → 389 −33% | 49 (was 38) |
Neighborhood Leaders: Morningside led all neighborhoods with $187M in total sales volume. Virginia-Highland saw its average price climb +11.7% to $1.57M across 53 sales, Candler Park surged from 18 to 53 sales over two years, and the City of Decatur held steady at 172 sales.
Neighborhood Watch List: East Point experienced sharp slowdowns (sales down from 216 to 84, average price −11.6%). Reynoldstown saw average prices dip −11.8%, Summerhill sales slowed from 28 to 9, and Inman Park saw average prices adjust −13.9% as days on market rose from 13 to 38 days.
2027 Market Scenarios
Mortgage rates climbed steadily through 2026, reaching roughly 7.1% for a 30-year fixed loan in early November. With the December 15–16 Federal Reserve meeting serving as the next major market catalyst, below are Adams Realtors’ three projected scenarios for 2027:
| Scenario | 30-Yr Rate | Avg. Price | Homes Sold | Days on Market |
|---|---|---|---|---|
| Base Case | 6.5%–7.0% | +3% to +5% | Flat (1,460–1,540) | 38–45 |
| Upside | Toward 6.0% | +5% to +7% | +5% to +10% (led by under $500K) | Toward 33 |
| Downside | 7.5%+ | Flat to −2% | −5% to −10% | 45+ |
Even in a slower rate environment, Intown Atlanta continues to outpace the broader Metro Atlanta market, where external forecasts (such as RealWealth) project only 0.5% to 2% price growth.
What It Means for Clients
For Sellers: Home values are holding firm, but buyers are taking longer to commit. Accurate, data-driven pricing from day one matters far more than it did two years ago.
For Buyers: The strongest negotiating leverage right now is in the under-$500K bracket and in neighborhoods where days on market have expanded. If mortgage rates dip, expect sidelined buyers to re-enter the market quickly.
Bottom Line
2027 should bring steady home prices alongside tight sales volume. Our base case anticipates average prices rising 3% to 5%, unit sales remaining largely flat, and homes taking somewhat longer to go under contract—with mortgage rates remaining the primary swing factor.
Methodology & Source: Adams Realtors Intown Market Survey, November 1, 2026. Decatur submarkets (Great Lakes, Oakhurst, and Winnona Park) are excluded from individual totals; for the purposes of this report, the City of Decatur is tracked as one unified market.