August Intown Market Report
By Bill Adams, President
Instead of focusing on the Average Sales Price in our report this month we will examine the cause of the decrease in transactions. We will compare the Number of Units Sold in our August 2025 report to the numbers from August 2020 and August 2015. We will scrutinize the financial and market forces that affect the number of sales.
First, let’s look at the results of our current market survey. For August, the Average Sales Price (ASP) for the market is $827,792. This is an 11% increase over the last year, a 15% increase over the last 24 months and a slight ($1,374) increase over July’s ASP. The Average Number of Days on the Market, 41 days, is an increase of 15% over the last year and unchanged from last month. The Number of Units Sold continued its downward trend as just 1,350 properties sold over the last year. In the continuation of another concerning trend, twenty-two markets experienced a decrease in Average Sales Price and there are two markets where there was no change in ASP for a total of 24 out of 39 markets that either went down or did not increase in price in the last 12 months.
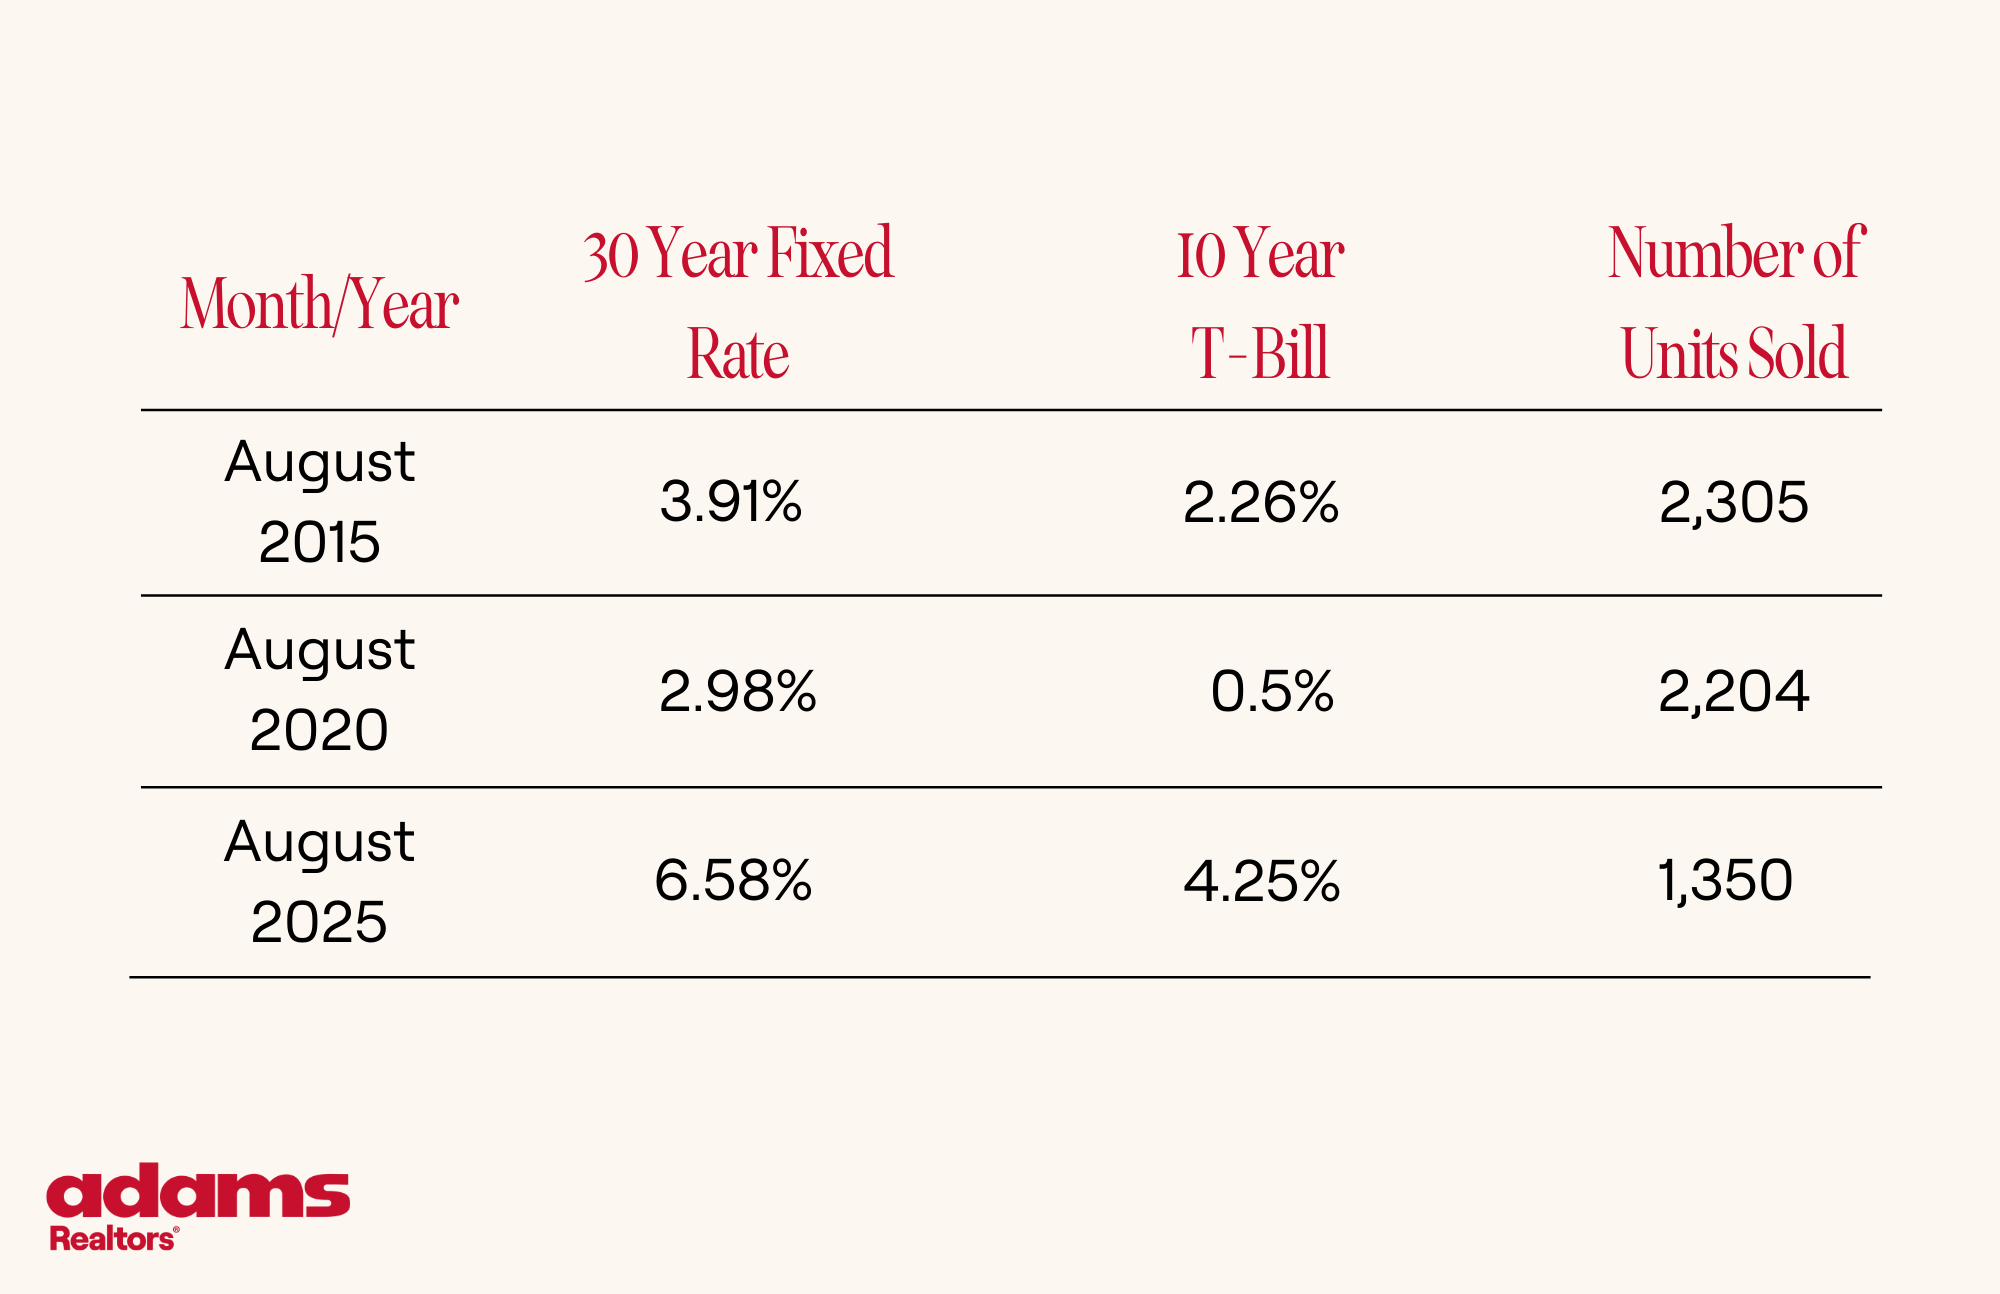
There are several reasons why in the last year there were 955 fewer properties that sold than in the same time period ten years ago despite an increase in population. One obvious reason, shown in the table below is the increase in home mortgage interest rates.
Below is a chart that shows the population changes in the City of Atlanta (28 of our markets), Avondale Estates, College Park, Decatur, East Point, Hapeville and Pine Lake over the last five and ten years.

The numbers in the two charts have the opposite effect on demand for housing. The top chart with higher current interest rates dampens demand and makes housing less affordable. The bottom chart with population trends mostly positive ought to increase demand. In the case of demand, in my opinion, the higher interest rates override any positive effects of an increase in population.
The supply in these, mostly urban markets, is relatively fixed due to the scarcity of buildable land. Tearing down an existing house to replace it with a new, bigger house does not add to the supply. Infill single-family housing developments tend to be small and do not have a noticeable effect on the overall supply.
Two additional issues have had a negative effect on the supply of housing. If you refer to the interest rate chart, those folks that purchased a house five years ago have a mortgage with an interest rate below 3%. Many of these homeowners are reluctant to sell their home and buy a replacement house with an interest rate at 6.58%. Finally, many baby boomers are not selling their homes to downsize or move to assisted living communities. The shear size of this generation creates a big supply problem. An entry level homeowner that wants to sell their starter home and move up to a larger home owned by a baby boomer may be blocked from doing so due to the lack of inventory. That homeowner will stay longer in their starter home thus limiting the supply of entry level homes available for first time buyers.
Next month we will continue to examine demographic issues and their effect on the current and future housing market. We will also study factors that affect the 10-year Treasury Bill that play a role in determining home mortgage interest rates.
Our team is always standing by to answer any real estate questions you have and to support all of your real estate needs. We’d love for you to be in touch.


