October Intown Market Report
By Bill Adams, President
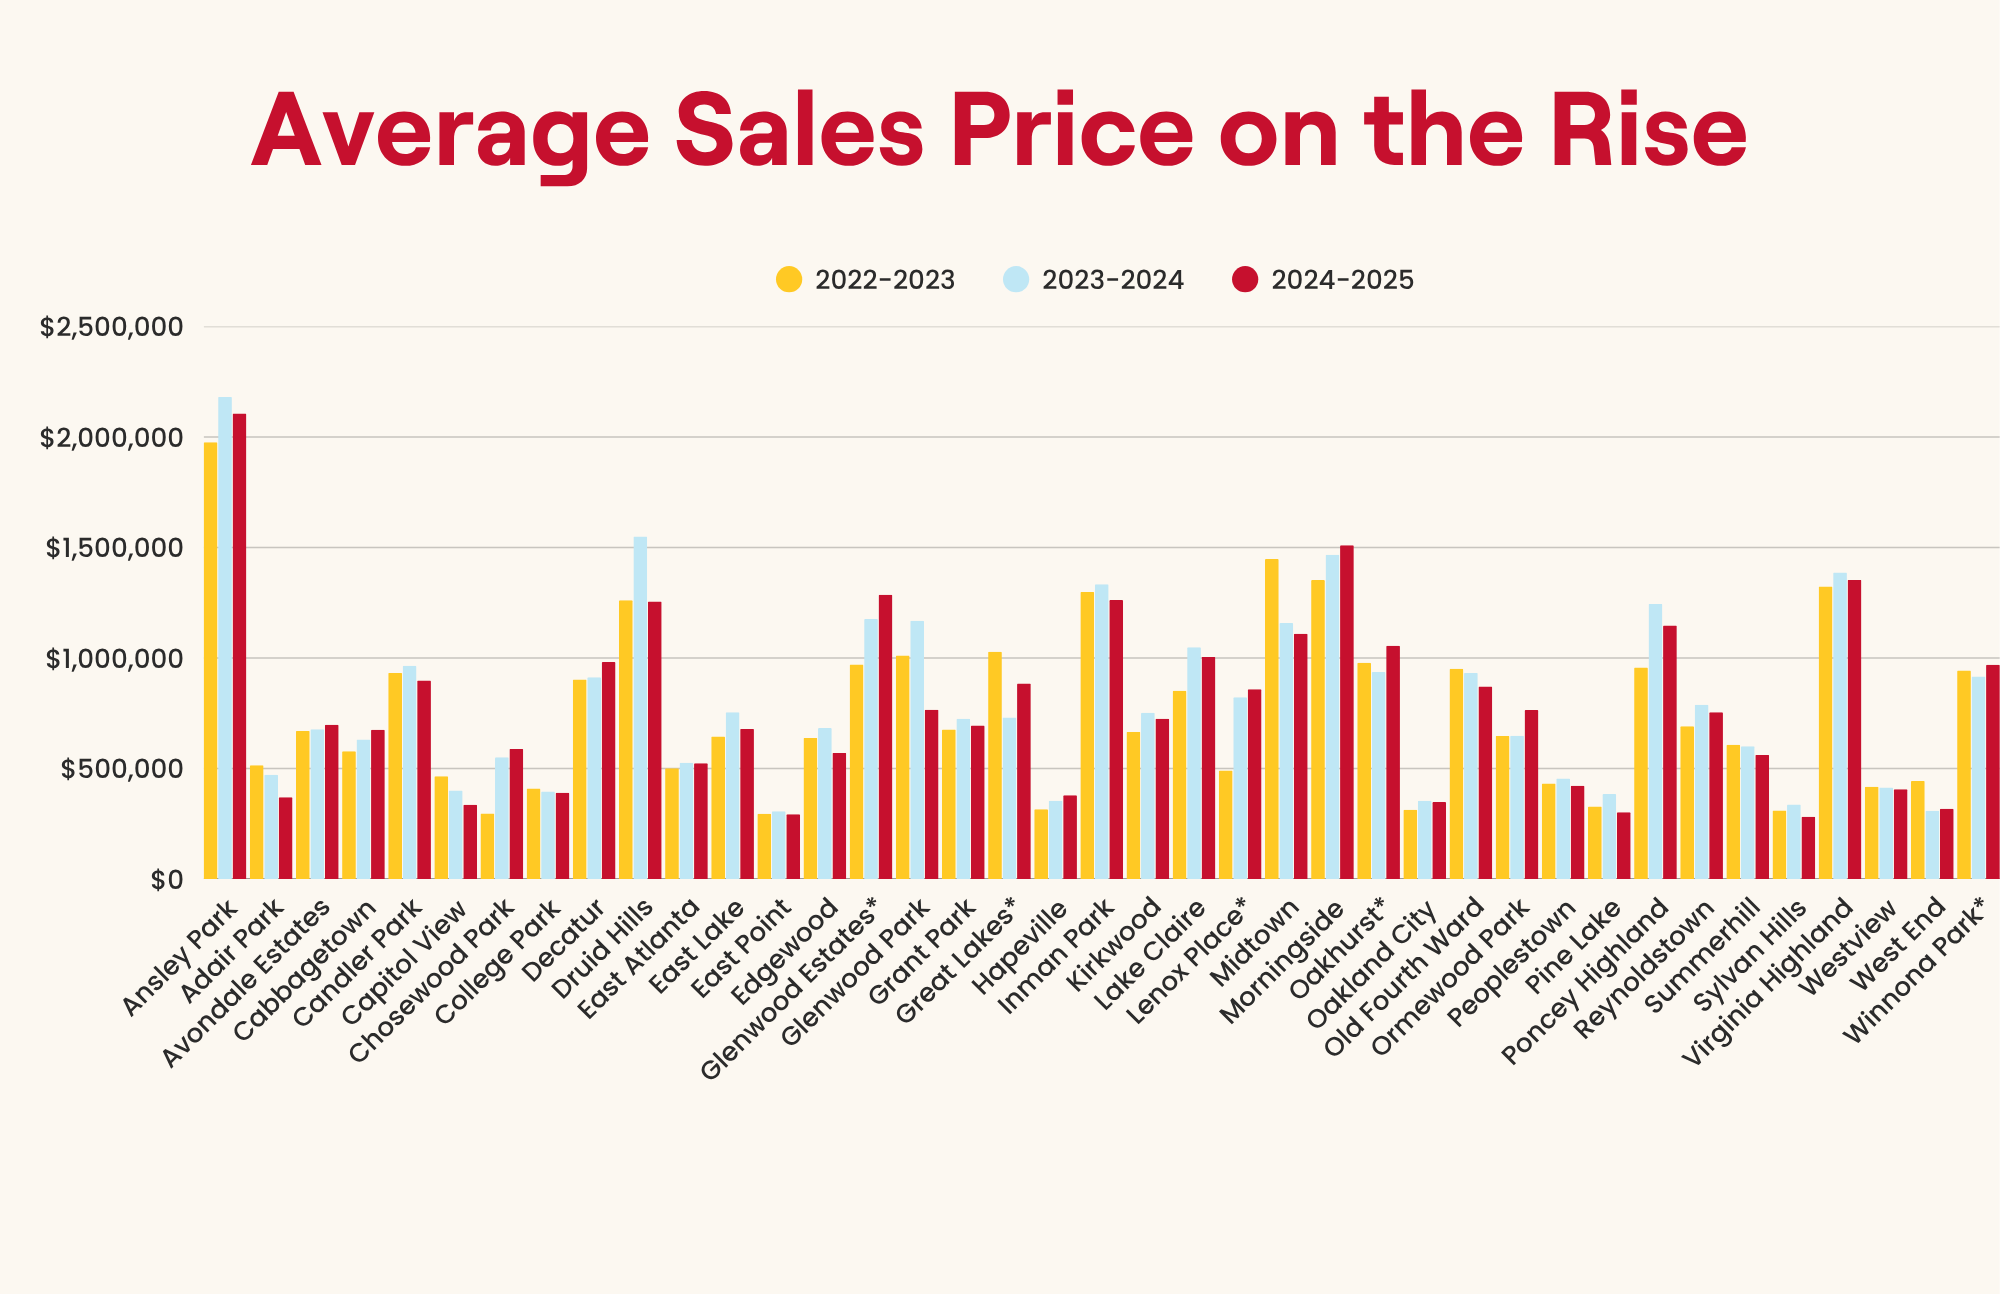
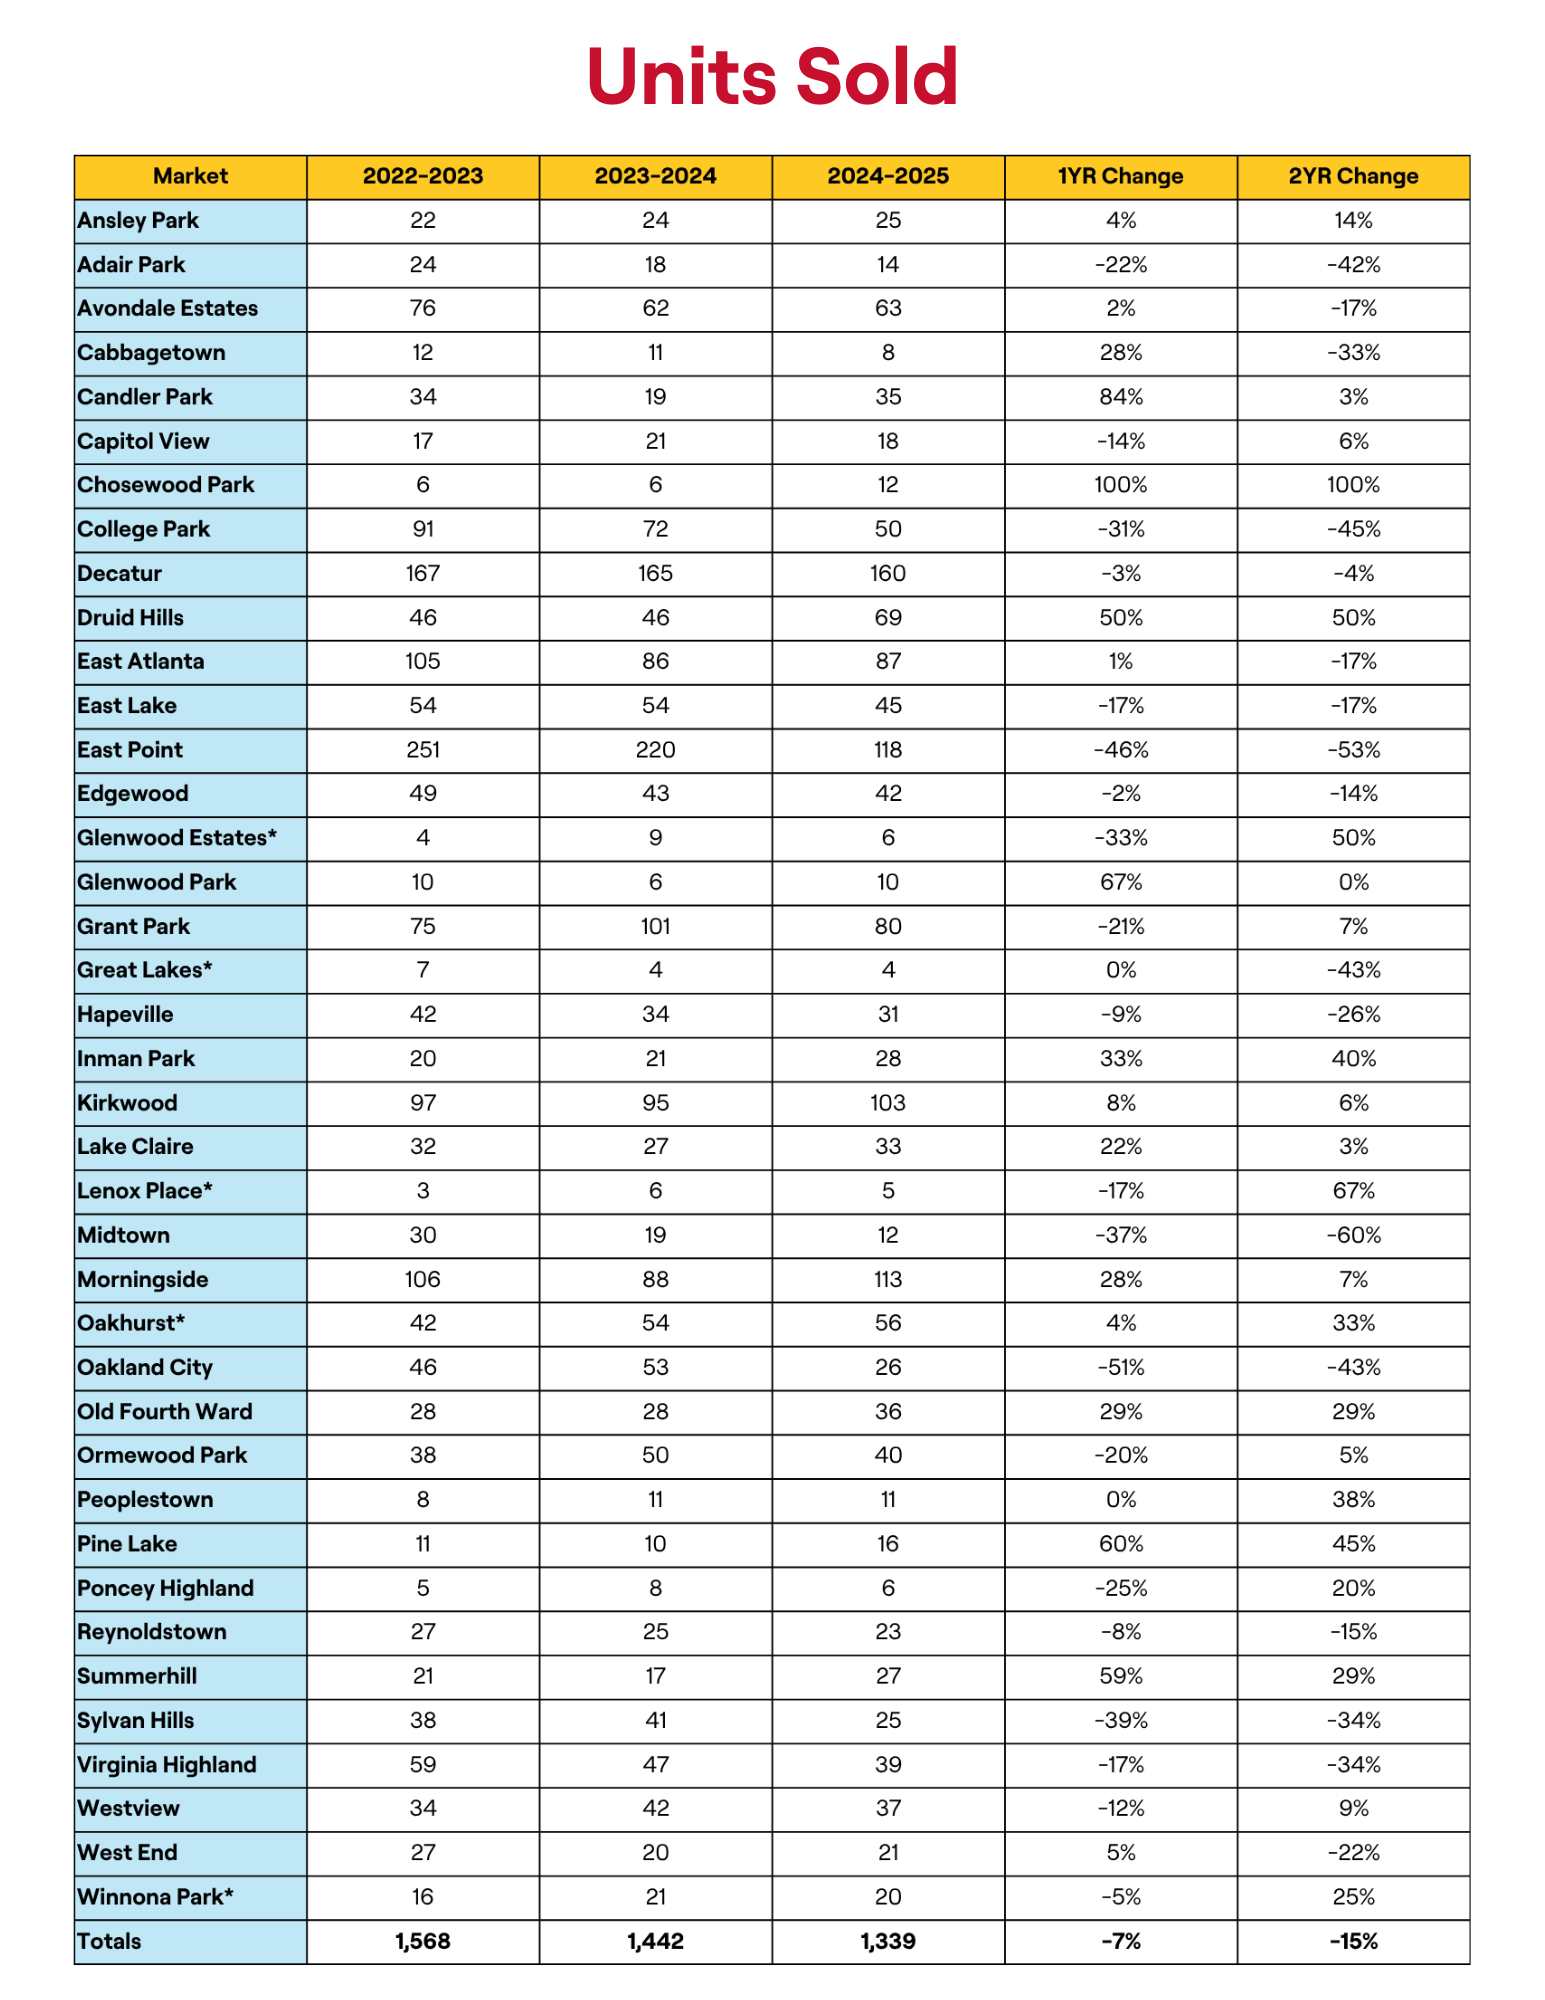
This month the Intown Atlanta single family residential market is exhibiting signs of weakness. The majority of the 39 markets that we track, 26 communities, experienced a year-over-year decrease in Average Sales Price. For October, the Average Sales Price(ASP) for the overall market is $822,632, at 7% year-over-year increase and a 13% increase in ASP over the last two years. If you are looking for other negative indicators, this month’s Average Sales Price for the Intown Atlanta market is about $8,000 less than September’s ASP. This is the first time in recent memory that the market has experienced a month over month decrease in Average Sales Price. The Average Number of Days on the Market is 42 days, an increase of 9% from the previous year, a 22% increase over the last two years and unchanged over the last several months. The Number of Units Sold totaled 1,339 properties, a 7% year over year decrease and a 15% fall in transactions from two years ago. The number of sales was up by 4 transactions from last month.
As promised in our last report, we will explore the connection between the 10-Year Treasury Note and home mortgage interest rates. The Federal Reserve’s Federal Open Market Committee sets monetary policy and thus gets most of the press regarding interest rates. The federal funds rate directly affects short- term interest rates and only indirectly affects long-term rates. The 10-Year Treasury Note has a more direct effect on mortgage rates.
The Connection Between the 10-Year Treasury Note and Mortgage Rates
The 10-year U.S. Treasury note yield is one of the most important benchmarks for long-term interest rates, including 30-year fixed mortgage rates.
Mortgage investors view the 10-year Treasury as a “risk-free” return — so when they invest in mortgage-backed securities (MBS), they demand a higher yield to compensate for risk (like borrower default or prepayment).
Typical spread between the Treasuries and Mortgage rates are usually about 1.5% to 2% higher than the 10-year Treasury yield.
For example:
If the 10-year yield = 4.0%, the average 30-year mortgage rate will be about 5.5% to 6.0%.
When the 10-Year Yield Rises
Investors expect higher inflation or faster economic growth, which erodes the value of fixed income returns.
They sell Treasuries, prices fall and yields rise.
Mortgage investors demand higher returns and mortgage rates increase.
When the 10-Year Yield Falls
Investors expect slower growth or a recession.
They buy Treasuries for safety, prices rise, and yields fall.
Mortgage investors accept lower yields and mortgage rates decrease.
Why Mortgage Rates Do Not Move Perfectly with the 10-Year Note
Although closely related, they don’t move in lockstep because of:
Changes in investor demand for mortgage-backed securities
Credit risk and prepayment risk are unique to mortgages
Federal Reserve policy, especially the Fed’s balance sheet of Mortgage Backed Securities
Market expectations of future Fed rate changes
A Useful Rule of Thumb to Track Mortgage Rate Trends:
Watch the 10-year Treasury yield as mortgage rates tend to move in the same direction, with about a 1 to 2 week delay.
Our team is always standing by to answer any real estate questions you have and to support all of your real estate needs. We’d love for you to be in touch.